-
Categories
-
Pharmaceutical Intermediates
-
Active Pharmaceutical Ingredients
-
Food Additives
- Industrial Coatings
- Agrochemicals
- Dyes and Pigments
- Surfactant
- Flavors and Fragrances
- Chemical Reagents
- Catalyst and Auxiliary
- Natural Products
- Inorganic Chemistry
-
Organic Chemistry
-
Biochemical Engineering
- Analytical Chemistry
-
Cosmetic Ingredient
- Water Treatment Chemical
-
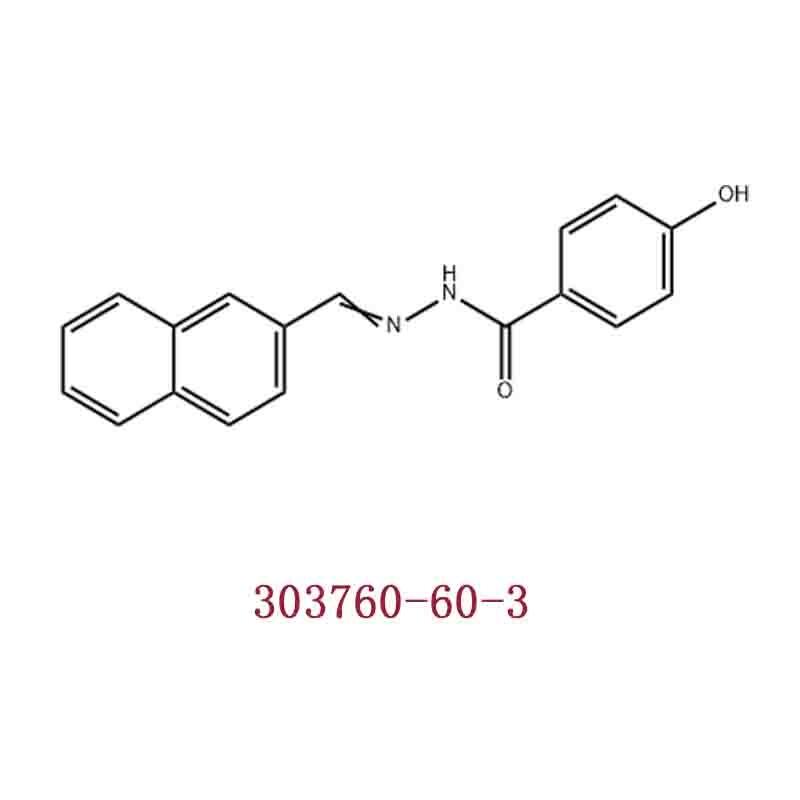
Pharmaceutical Intermediates
Promotion
ECHEMI Mall
Wholesale
Weekly Price
Exhibition
News
-
Trade Service
BackgroundAlthough chemical displacement coding (CSE) MRI proton density fat fractions (PDFF) are currently a non-invasive reference method for evaluating liver fat quantification, it is more common to use CT for liver screeningpurposethis study aims to verify the difference between the quantitative indicators of fatty liver CT and the MRI PDFF reference standardsmaterials and methodsthis prospective study included 400 healthy subjectsEach subject had an abdominal CT flat sweep and a 3.0T MRI CSE examination on the day of the examinationThe CT fat measurement index formula was standardly used by CSE MRI liver fat quantitative index and placed it in the PDFF fat rangeThe CT and PDFF liver fat content indicators were made with scatterplots and the median and quartile spacing between the two groups were comparedTake the scatter plot and the Bland-Altman graph to calculate the Pearson correlation coefficientThe difference in mild (PDFF, 5%), moderate (PDFF, 14%) fat denation truncate values were evaluated by area under the ROC curveCalculate sensitivity, specificity, positive prediction, and negative predictionresultsin 400 subjectsThe liver fat MRI PDFF indicator ranged from 0%-28%, of which 41.5% (166/400) of the subjects had a PDFF of 5%The original and post-corrected quantitative CT values are well correlated with MRI PDFF (r2 s 0.79; P .001Corrective CT value Bland-Altman analysis shows no overlays and cheapnessThe original and corrective CT indicators rated subjects with mild (PDFF, .5%) and heavy (PDFF, .14%) of fatty liver under the ROC curve of 0.87, 0.99Non-corrective CT indicators detected pF sensitivity, specificity, positive predictions and negative predictions of 75.9% (126 of 166), 85.0% (199 of 234), 78.3% (126 of 161), and 83.3% (199 of 22) 39), the sensitivity, specificity, positive prediction and negative predictions of 14% of PDFF were 84.8% (28 of 33), 98.4% (361 of 367), 82.4% (28 of 34), and 98.6% (361 of 366)The results of the corrected CT index in evaluating the degree of fatty liver were similarConclusion
quantitative CT liver fat content index and chemically displaced-encoded MRI proton density fat fraction scored well correlated and accurate